
spharpy.spatial#
Wave field representations in the spatial domain.
Functions:
|
Green's function for plane waves in free space in matrix form. |
|
Green's function for point sources in free space in matrix form. |
- spharpy.spatial.greens_function_plane_wave(source_points, receiver_points, wave_number, gradient=False)[source]#
Green’s function for plane waves in free space in matrix form. The matrix describing the propagation of a plane wave from a direction of arrival defined by the azimuth and elevation angles of the source points to the receiver points. The phase sign convention reflects a direction of arrival from the source position.
\[G(k) = e^{i \mathbf{k}^\mathrm{T} \mathbf{r}}\]- Parameters:
source_points (
pyfar.Coordinates) – The source points defining the direction of incidence for the plane wave. Note that the radius on which the source is positioned has no relevance.receiver_points (
pyfar.Coordinates) – The receiver points.wave_number (float, complex) – The wave number. A complex wave number can be used for evanescent waves.
gradient (bool) – If
True, the gradient will be returned as well. Default isFalse.
- Returns:
M – The plane wave propagation matrix with shape [n_receiver, n_sources].
- Return type:
ndarray, complex
Examples
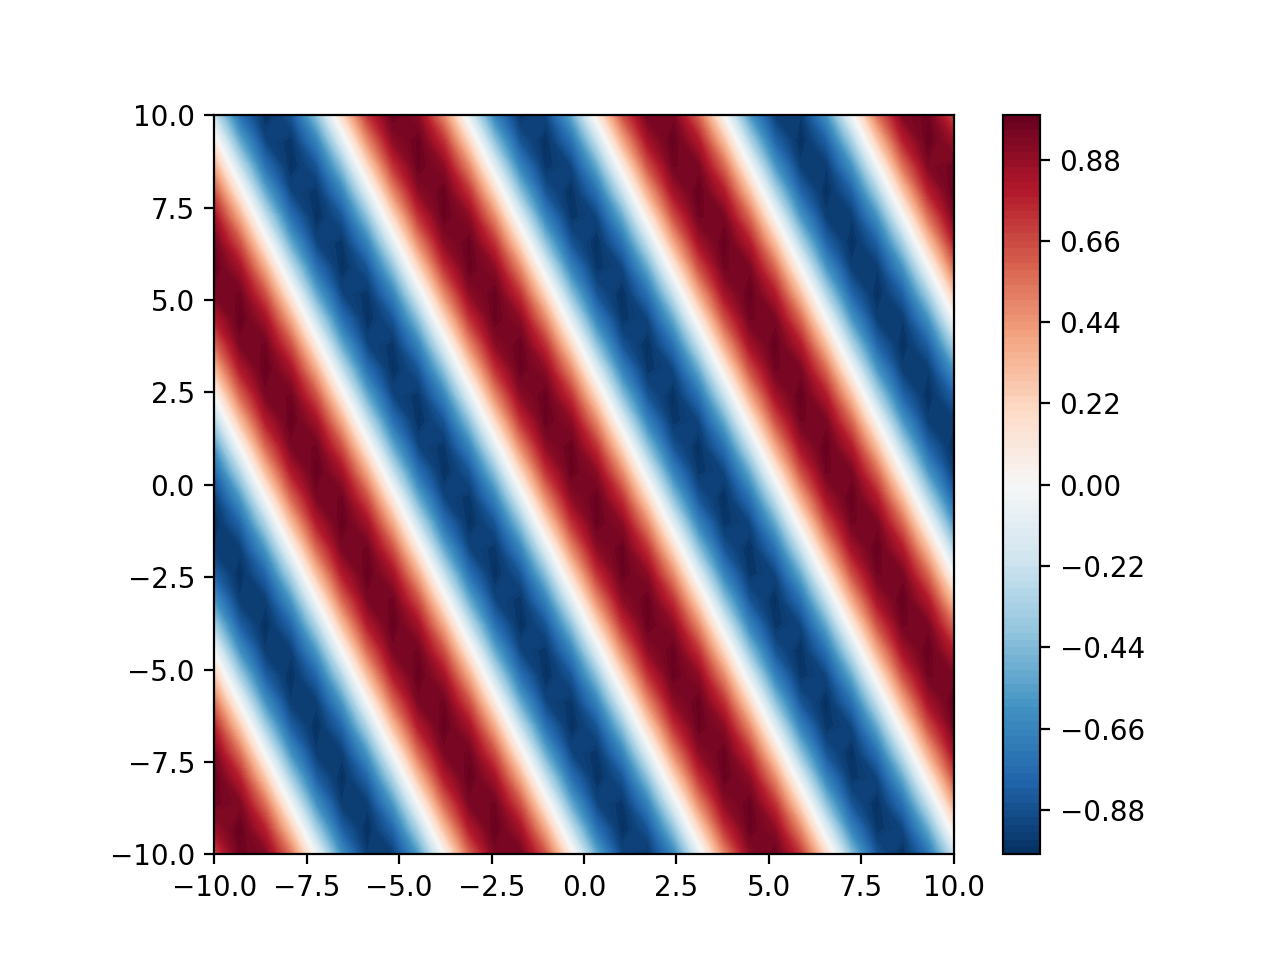
Plot Green’s function in the x-y plane for a plane wave with a direction of incidence defined by the vector \([x, y, z] = [2, 1, 0]\).
>>> import numpy as np
>>> import matplotlib.pyplot as plt
>>> from pyfar import Coordinates
>>> import spharpy
...
>>> spat_res = 30
>>> x_min, x_max = -10, 10
>>> xx, yy = np.meshgrid(
>>>     np.linspace(x_min, x_max, spat_res),
>>> np.linspace(x_min, x_max, spat_res))
>>> receivers = Coordinates(
...     xx.flatten(), yy.flatten(), np.zeros(spat_res**2))
>>> doa = Coordinates(2, 1, 0)
...
>>> k = 1
>>> plane_wave_matrix = spharpy.spatial.greens_function_plane_wave(
...     doa, receivers, k)
>>> plt.figure()
>>> plt.contourf(
...     xx, yy, np.real(plane_wave_matrix.reshape(spat_res, spat_res)),
...     cmap='RdBu_r', levels=100)
>>> plt.colorbar()
>>> ax = plt.gca()
>>> ax.set_aspect('equal')
(
Source code,png,hires.png,pdf)
For evanescent waves, a complex wave number can be used
>>> import numpy as np
>>> import matplotlib.pyplot as plt
>>> from pyfar import Coordinates
>>> import spharpy
...
>>> spat_res = 30
>>> x_min, x_max = -10, 10
>>> xx, yy = np.meshgrid(
>>>     np.linspace(x_min, x_max, spat_res),
>>> np.linspace(x_min, x_max, spat_res))
>>> receivers = Coordinates(
...     xx.flatten(), yy.flatten(), np.zeros(spat_res**2))
>>> doa = Coordinates(2, 1, 0)
...
>>> k = 1-.1j
>>> plane_wave_matrix = spharpy.spatial.greens_function_plane_wave(
...     doa, receivers, k, gradient=False)
>>> plt.contourf(
...     xx, yy, np.real(plane_wave_matrix.reshape(spat_res, spat_res)),
...     cmap='RdBu_r', levels=100)
>>> plt.colorbar()
>>> ax = plt.gca()
>>> ax.set_aspect('equal')
(
Source code,png,hires.png,pdf)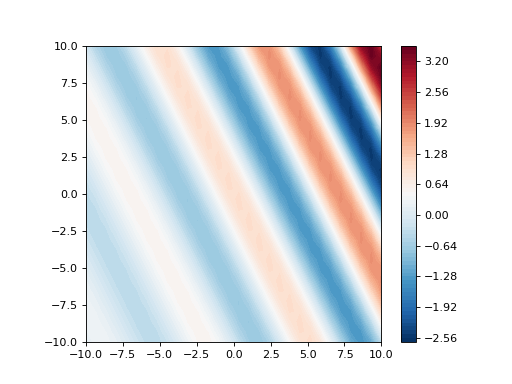
- spharpy.spatial.greens_function_point_source(sources, receivers, k, gradient=False)[source]#
Green’s function for point sources in free space in matrix form. The phase sign convention corresponds to a direction of propagation away from the source at position \(r_s\).
\[G(k) = \frac{e^{-i k\|\mathbf{r_s} - \mathbf{r_r}\|}} {4 \pi \|\mathbf{r_s} - \mathbf{r_r}\|}\]- Parameters:
sources (
pyfar.Coordinates) – source points as Coordinates objectreceivers (
pyfar.Coordinates) – receiver points as Coordinates objectk (ndarray, float) – The wave number
gradient (bool, optional) – Flag to indicate if the gradient should be computed and returned. The default is
False.
- Returns:
G – Green’s function
- Return type:
ndarray, double
Examples
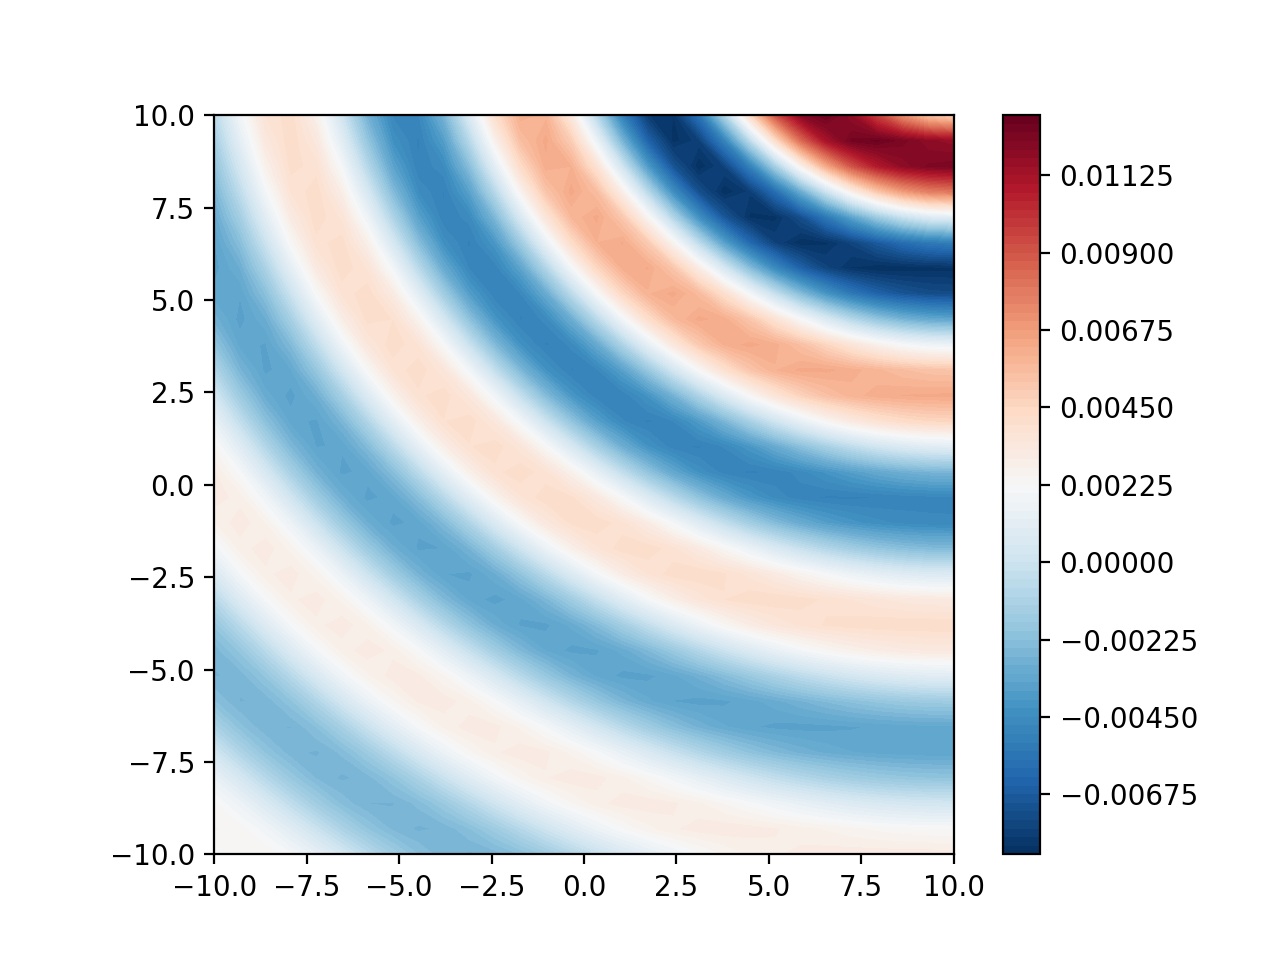
Plot Green’s function in the x-y plane for a point source at \([x, y, z] = [10, 15, 0]\).
>>> import numpy as np
>>> import matplotlib.pyplot as plt
>>> from pyfar import Coordinates
>>> import spharpy
...
>>> spat_res = 30
>>> x_min, x_max = -10, 10
>>> xx, yy = np.meshgrid(
>>>     np.linspace(x_min, x_max, spat_res),
>>> np.linspace(x_min, x_max, spat_res))
>>> receivers = Coordinates(
...     xx.flatten(), yy.flatten(), np.zeros(spat_res**2))
>>> doa = Coordinates(10, 15, 0)
>>> plane_wave_matrix = spharpy.spatial.greens_function_point_source(
...     doa, receivers, 1, gradient=False)
>>> plt.contourf(
...     xx, yy, np.real(plane_wave_matrix.reshape(spat_res, spat_res)),
...     cmap='RdBu_r', levels=100)
>>> plt.colorbar()
>>> ax = plt.gca()
>>> ax.set_aspect('equal')
(
Source code,png,hires.png,pdf)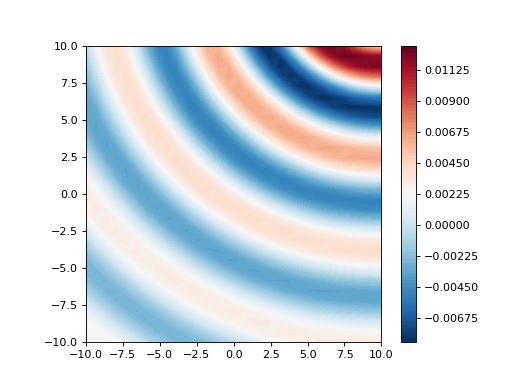